
Ice Melts; The Sea Rises; The Land Rebounds
During the Pleistocene (after 2.6 million years ago) New England and New York were repeatedly covered by ice sheets. The last of these, the 2-mile-thick Laurentide ice sheet, advanced to its southernmost front across Long Island (the Harbor Hill Moraine) around 28,000 cal BP (calibrated years before present). Terminal moraine deposits also occur across northern Staten Island and extend westward across New Jersey into Pennsylvania. Most of the local soil types formed in the glacial till or outwash.
The glacier began to melt and retreat after 23,700 cal BP. The ice front had receded to the Canadian border by ca. 13,500 cal BP (Ridge 2003; Ridge et al. 2012). The remnant ice sheet continued to shrink over the ensuing millennia, but it had a lingering effect on the climate of the Northeast until 8000 cal BP.
The ice front had retreated as far as the northern edge of the present Long Island Sound at ca. 20,400 cal BP. A meltwater lake, called Glacial Lake Connecticut, occupied the basin of the Sound until sometime between about 16,500 and 13,500 cal BP. Its draining may have been caused by a sudden influx of meltwater from Glacial Lake Hitchcock, which lay in the present Connecticut River Valley; that lake drained rapidly around 14,100 cal BP.
The retreating ice left in its wake meltwater lakes in low-lying areas. One of these lakes ultimately filled with sediment, becoming the 55-square-mile “Black Dirt” bog, now drained farmland in the southwestern part of Orange County, New York. At least 41 mastodont fossils have been discovered in the muck deposits of the Black Dirt and other swampy areas in Orange County (Dumont and Ehlers 1973).
For some time during the glacial retreat, glacial Lake Iroquois—much larger than modern Lake Ontario-- was connected to glacial Lake Albany, in the Hudson Valley, through the Mohawk Valley. Around 13,300 cal BP, glacial Lake Iroquois drained catastrophically through Lake Albany, and then through the Narrows (between Staten Island and Brooklyn), into the North Atlantic. This meltwater input may have caused a disruption of thermohaline circulation in the ocean, which triggered a cold episode known in Europe as the Intra-Allerød Cold Period (Donnelly et al. 2005).
With great quantities of water locked up in the ice sheets at the Last Glacial Maximum (LGM) (ca. 24,000 cal BP), global sea level had fallen reciprocally to about 120-134 meters (400-440 feet) below the present level (Lambeck et al. 2014). New Jersey’s coast was then approximately 80 to 90 miles (140 to 155 kilometers) east of its present location, and the Delaware Bay and New York Harbor were shallow river valleys.
As the ice melted and retreated, vast quantities of water returned to the ocean, which rose both gradually and in several rapid surges. The rising sea inundated the landscape of the continental shelf. Farther inland, former freshwater streams became tidal estuaries.
Global sea level rose by about 10 to 15 meters (33 to 49 feet) between 21,000 and 18,000 cal BP. After 1,500 years at a near-constant level, the sea rose by about 25 meters (82 feet) between 16,500 and 15,000 cal BP. After the abrupt onset of the Bølling warm period at 14,650 cal BP, the sea rose very rapidly by about 9 to 14 meters (30 to 46 feet) (Liu et al. 2016); this is known as Meltwater Pulse (MWP) 1A. There is disagreement about the precise dating of MWP 1A (Harrison et al. 2018), with some scientists putting it at about 14,000 to 13,800 cal BP (Stanford et al. 2006), others at about 14,600 to 14,300 cal BP (Deschamps et al. 2012). The rate of sea level rise slowed during the Younger Dryas (YD) cold period (12,850 to 11,650 cal BP); with abrupt post-YD warming (the beginning of the Holocene or modern epoch), the rate of rise sped up again (Bard et al. 2010). Some oceanographers have seen evidence of another step-like, abrupt, rapid rise in the Atlantic Ocean of about 7.5 meters (25 feet) known as MWP 1B (11,500 to 11,000 cal BP) (Abdul et al. 2016).
The sea continued to rise by 50 to 60 meters (164 to 197 feet) during the early Holocene (between 11,500 and 8000 cal BP). Another minor meltwater pulse (MWP 1C, 8200 to 7600 cal BP) seems to have been associated with final draining of the giant periglacial Lake Agassiz from western Canada into the North Atlantic and the synchronous 8200 cal BP cold event; sea level rose by about 1 meter (3.3 feet) (Tornqvist and Hijma 2012). The rate of sea level rise then slowed around 7500 cal BP. MWP 1C seems to have resulted in a sudden influx of seawater into the Chesapeake Bay and the first appearance of oysters there about 8000 cal BP (Bratton et al. 2003).
The changing positions of relative sea level along the Middle Atlantic and New England coast during the Holocene (after 11,600 cal BP) were determined by a complicated interplay of eustatic and isostatic factors (Engelhart and Horton 2012; Engelhart et al. 2011; Horton et al. 2013). The dominant factor was eustatic; as ice sheets and montane glaciers melted because of warmer temperatures and increasing sunlight, water that had been locked up in the ice drained into the oceans. A minor additional effect was expansion of the ocean because of the warming water.
Interpretation of the sea level record is complicated by postglacial rebound or “glacioisostatic adjustment” (McMaster 1984; Stone and Borns 1986). As the weight of the mile-high ice sheet was lifted from the Northeast, the land formerly beneath the ice rose. In Rhode Island, this isostatic rebound is now estimated as about 30 meters (Oakley and Boothroyd 2012). During glaciation, the earth’s mantle south of the ice front, perhaps as far south as the Carolinas, had been squeezed up into a “forebulge.” Since the retreat of the ice, the forebulge has been subsiding, which can cause local relative sea level to rise at an apparently faster rate (Scott et al. 2010).
When Did the Ocean Fill Long Island Sound?
The combination of post-glacial warping and sea level rise resulted in the first filling of Long Island Sound by seawater. The date of this initial “marine transgression” remains a matter of debate. Stone et al. (2005) dated bits of terrestrial plant matter in Sound sediment, concluding that marine transgression began about 14,500 cal BP, perhaps as a result of MWP 1a. However, Varekamp and Thomas (2005) and Thomas et al. (2007) dated shells in the sediments instead, finding that the plant samples from the same depths produced much older ages. They suggested that long-dead, buried plant remnants had been transported from old lakebeds. Although radiocarbon dates on shell are notoriously often erratic (typically too old because of a “marine reservoir effect’), Varekamp and Thomas argue that in this case, they are more reliable than the dates on the plant remains. According to their chronology, the basin was dry land for some 4,000 years after the emptying of Lake Connecticut; the intrusion of ocean water began only around 10,000 cal BP. Varekamp and Thomas suggest that this transgression may have been caused by Meltwater Pulse 1b; however, this is a poor chronological fit, because MWP 1b occurred 1500 years earlier. The presence of a dry basin from ca. 14,000 to 10,000 cal BP could explain the dating of loess (windblown silt) on Long Island to about 13,000 cal BP (Kundic 2005); however, this late date alternatively might only reflect problems in the dating process.
Holocene Sea Level Rise: Gradual or Punctuated?
There is conflicting evidence as to the gradual or punctuated character of the sea’s rise during the Holocene. One would expect some minor acceleration or deceleration corresponding, respectively, to warming and cooling climatic episodes during the Holocene (e.g., the Hypsithermal, the Medieval Optimum, and the Little Ice Age). Some oceanographers have even reported evidence that the mid-Holocene (ca. 7000-5000 cal BP) Hypsithermal sea level was higher than present, particularly in the Pacific (e.g., Leonard et al. 2018).
Leonard et al. (2018) present data on sea level from Australia’s Great Barrier Reef, based on uranium-thorium dating of coral microatolls. Australia’s coastline is tectonically stable and was never depressed by Pleistocene ice sheets. Thus, unlike the coast of eastern North America, local isostatic effects are assumed to be minimal. On the Australian coast, sea level reached a highstand about half a meter above the present level around 7000 cal BP, then fell rapidly in two punctuated episodes at 5500 and 4600 cal BP. A third possible lowstand occurred after about 2800 cal BP. These rapidly lowered sea levels appear to correlate with cooler Pacific Ocean surface temperatures and other proxies of colder climate in both the Northern and Southern hemispheres (Leonard et al. 2018).
Gayes and Bokuniewicz (1991) identified three episodes of sea level rise preserved as submerged paleoshorelines within Long Island Sound. They follow Lewis and Stone (1991) and Stone et al. (2005) in dating the initial marine transgression at around 14,700-14,300 cal BP. This was followed by a stable sea level at a depth of -40 meters below the present level. Isostatic rebounding of the crust caused a regression, followed by another extended transgression leading ultimately to the present water level. These events created a shoreline at -37 meters (dated to about 11,500-12,000 cal BP) and another at -25 to -27 meters (dated to around 10,200-11,000 cal BP).
Miller et al. (2009:16) found “surprising uniformity” in the rates of relative sea level (RSL) rise from 5000 to 500 cal BP along the coast from Delaware to New England, despite the varying distances from the peripheral forebulge of the Laurentide ice sheet: about 1.7 to 1.9 millimeters per year. They attribute about half of this relative rise to subsidence of the forebulge. Although they perceive a “monotonic” rise of sea level through this period, Miller et al. caution that gaps of 1,000 years or more in the dated sediment cores would allow some variation of rate during this period. In fact, correcting for the rebound effect, Kemp et al. (2013) find that RSL actually fell slightly between 2500 and 1750 cal BP (at a rate of 0.11 millimeter per year) and between cal AD 730 and 1850 (at a rate of 0.12 millimeter per year). Between about cal AD 250 and 730, the rate of sea level rise accelerated to +0.62 millimeter per year and RSL rose by about 25 centimeters.
The island of Mallorca off southern Spain is tectonically stable, so the relative sea level there primarily reflects global eustatic processes. Based on their uranium-series dating of speleothems in caves on the island’s coast, Asmerom et al. (2020) find that the local sea level has generally been near the present level since 3900 cal BP. The exception is the period between 3250 and 2800 cal BP, when the sea rose rapidly by 25 centimeters Asmerom et al. suggest that this surge may have been caused by melting of either the Antarctic or Greenland ice sheets. This event seems to be echoed in some way by the possible lowstand in Australia at 2800 cal BP (Leonard et al. 2018) and by processes observed on the coast of the Northeast US around 2800-1700 cal BP.
During the Holocene, as the sea rose along the coast of the Northeast US, it inundated coastal deltas and formed mud flats, saltwater marshes, and low marshy islands. Coastal estuaries extended far up the major rivers, and salt marshes developed along the drowned river valleys.
Table: Relative Sea Levels (meters below present level) along the Northeast Coast since 14,000 cal BP
|
Date (cal BP) |
Rhode Island |
Connecticut (Long Island Sound) |
New York Harbor |
New Jersey Coast |
Delaware Bay |
|
1000 |
-1 |
-1.4 |
-1 |
|
-1 |
|
2000 |
-2 |
-2 |
-2.5 |
-4 |
|
|
3000 |
-4 |
-2 |
-4.5 |
-4.2 (2500) |
-3 |
|
4000 |
-6 |
-3 |
-6 |
|
|
|
5000 |
-8 |
-8 |
-7 |
-9 |
-7 |
|
6000 |
-12 |
-9 |
-9 |
|
-13 |
|
7000 |
-15 |
-10 |
-10 |
|
-15 |
|
8000 |
|
-12 |
-14 |
-12 |
|
|
9000 |
|
-15 |
-23 |
|
-22 |
|
10,000 |
|
-25 |
|
|
|
|
11,000 |
-35 |
-37 |
|
|
|
|
12,000 |
-50 |
|
|
|
|
|
13,000 |
-65 |
|
|
|
-26 |
|
14,000 |
-80 |
|
|
|
|
Sources: Rhode Island: Donnelly 1998; McMullen et al. 2007; Oakley and Boothroyd 2012
New Jersey: Miller et al. 2009; Horton et al. 2013; Kemp et al. 2013
Long Island Sound: Gayes and Bokuniewicz 1991; Kemp et al. 2017
Delaware Bay: Kraft 1976, Nikitina et al. 2000
New York Harbor: Schuldenrein et al. 2014
Holocene relative sea levels near Manhattan (from Schuldenrein et al. 2014)
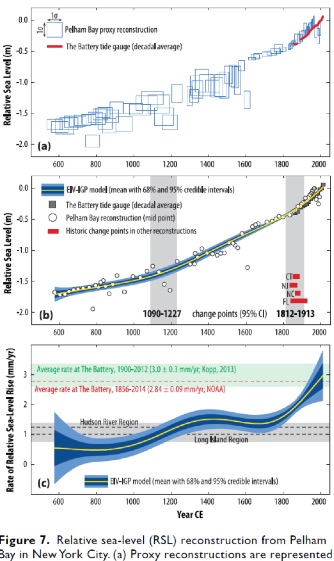
RSL since cal AD 600 in Pelham Bay (from Kemp et al. 2017)
Dated tidal marshes in New Jersey and Delaware consistently indicate that initial marsh formation began between about 2700 and 1700 cal BP. Psuty (1986) and Ferland (1990:63), hypothesized that the rate of sea level rise decreased markedly around 2500-2000 cal BP, which allowed the marshes to form. On the Rhode island coast, a radiocarbon date from Nag Creek Marsh is 2420+-35 cal BP (roughly 2500 cal BP); this sample was derived from about 2.5 meters below the present sea level (Donnelly and Bertness 2001).
Data from shoreline locations in the Northeast and Mid-Atlantic suggest an unusual, complicated situation between ca. 2300 and 1800 cal BP. Around the Delaware Bay, tidal wetlands (represented now by peats) expanded as the sea retreated around 2300 cal BP; then, these wetlands were covered by mud as the local sea level rose rapidly again at 2000 cal BP (John and Pizzuto 1995). The tidal wetlands expanded again around 900 cal BP (cal AD 1050). The regressions of the bay hypothesized by John and Pizzuto appear to roughly correspond to the periods of slight sea-level fall calculated by Kemp et al. (2013) (2500 to 1750 cal BP and cal AD 730 to 1850).
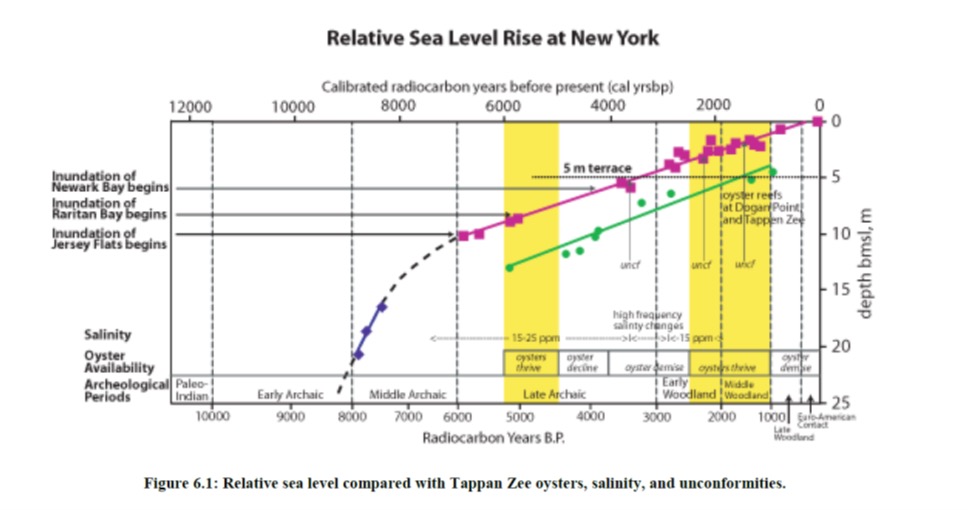
In the Lower New York Harbor, Schuldenrein et al. (2014) identified erosional surfaces at about 4.6 meters (15 feet) below present sea level that they interpret as an apparent still-stand or regression of sea level between 3000 and 2000 cal BP. They note that a hiatus in the occupation of the Tappan Zee area by oysters is approximately contemporaneous (3400-2800 cal BP, Carbotte et al. 2004). The oysters may have been unable to survive in less saline water resulting from lowered sea level and retreat of the saltwater wedge in the estuary. By 2000 cal BP sea level rise resumed as indicated by back-flooding of the headwaters of Arthur Kill (between Staten Island and New Jersey) near present Newark Bay. In the lower Hudson Valley, renewed deposition of sediments on the marginal flats of the Tappan Zee at 2500 to 1800 cal BP may be a manifestation of the same transgressive event (Carbotte et al. 2004).
At the mouth of the Connecticut River, the Sound water rose more rapidly than the riverborne sediment about 4500 cal BP, converting the floodplain into open backwater coves. The Sound flooded farther up the estuary around 2800 cal BP, and the river became tidal. At about 1700 cal BP (cal AD 300) the RSL dropped abruptly, and freshwater marshes extended into the former coves. Salt marshes appeared at the mouth of the estuary at cal AD 1000 (Patton and Horne 1992).
Elsewhere along the Connecticut coast, RSL seems to have risen rapidly between 1800 and 1600 cal BP (van de Plassche 1991; Varekamp et al. 1992). Besides the rapid rise he inferred at 1800 cal BP, van de Plassche (1991) hypothesized a series of step-like rises of RSL on the Connecticut shoreline during the late Holocene, with rapid events at 1600, 950, 500, and 200 cal BP (cal AD 400, 1050, 1500, and 1800).
Nydick et al. (1995) inferred that relative sea level rose steadily on the Connecticut coast, east of New Haven, from AD 250 to 1100 by about 0.9 mm per year. The rate may have sped up around AD 700, and accelerated again from AD 1000-1100. The rate of rise slowed down to about 0.5 mm per year from AD 1100 to 1600. Then it accelerated again between AD 1600 and 1700, possibly slowed down briefly between 1700 and 1800, and then continued rising from 1800 to the present day.
Recently reported data from a salt marsh at Pelham Bay, about 19 km (12 miles) southwest of the Marshlands, indicate that local relative sea level was 1.7 meters lower than present at AD 575 (1400 cal BP). The rate of RSL rise was about 0.5 mm/yr at AD 600–1000, increased to a peak of about 1.52 mm/ yr at ca. AD 1400, and afterward slowed to 1.37 mm/yr at ca. AD 1630. Since then, the rate of RSL rise increased continuously; it is now 2.98 mm/yr, the fastest rate in the past 1500 years (Kemp et al. 2017).
The present depth of Milton Harbor is about 6 feet (1.8 meters). At the southwest end of Hen Island, the water is 8 feet (2.4 meters) deep. Blind Brook must have flowed through the present embayment before local sea level rose high enough to drown its mouth. This flooding appears to have occurred around 3000 cal BP, when the Sound rose from about -3 to -2 meters below its present level.
Post-Glacial Climate and Environmental Changes
Studies of annually-deposited varved clays in ancient glacial lake beds, supported by radiocarbon dates on bits of vegetation and cosmogenic nuclide dates on boulders first exposed to radiation when the ice retreated, indicate that northern New Jersey and southeast New York were ice-free by ca. 18,800 cal BP (Ridge et al. 2013). However, AMS radiocarbon dates of 12,200-12,700 rcbp from the basal sediments of ponds in this region indicate that tundra-like vegetation-- mosses and stunted shrubs-- only began to colonize the barren landscape between 15,200-14,100 cal BP (Peteet et al. 2012). It seems improbable that the region would have remained without any vegetation for 4,000 years, but the ostensible hiatus remains unexplained.
As vegetation from the south re-colonized the deglaciated landscape, so did the big herbivores that fed on it. The tundra vegetation was adequate to sustain grazing mammoths in northern Westchester County by about 15,500 cal BP, the age of the Kitchawan Mammoth. Following abrupt onset of the Bølling warm period at 14,700 cal BP, spruce trees spread rapidly into the region, followed by fir, oak, ash, beech, and hornbeam. Spruce twigs were a dietary staple of mastodonts. The oldest mastodonts from the concentration in Orange County date to about 14,300 cal BP (Feranec and Kozlowski 2012). East of the Hudson River, mastodonts are comparatively rare, but they evidently arrived at the same time. A mastodont found in Farmington, CT, has been dated to ca. 14,900-14,300 cal BP (Boulanger and Jones 2015).
Pollen cores from Lake Mohonk and Lake Minnewaska in the Shawangunk Mountains (Menking et al. 2012) indicate a cool and humid climate from ca. 14,000 to 12,900 cal BP. The mixed thermophilous deciduous-boreal forest included birch, spruce, and oak (which accounted for 15-20 percent of the pollen).
Post-glacial warming was abruptly interrupted at 12,850 cal BP by the Younger Dryas cold episode, which lasted for 1200 years. Pollen sequences from northern New Jersey show the effect of the nearly glacial Younger Dryas conditions on the regional flora, which responded very rapidly to the climate change (Peteet et al. 1990; Yu 2007). Spruce increased to a maximum during this period.
In the Shawangunk Mountains, the climate during the Younger Dryas (12,850-11,650 cal BP) is reconstructed as cold and wet based on the abundance of alder and birch pollen in the lake sediment cores (Menking et al. 2012). Hemlocks arrived here ca. 12,700 cal BP.
Within only a few decades at 11,650 cal BP, temperatures soared in the Northern Hemisphere (about 4˚C in the northeastern U.S.), marking the onset of the present Holocene interglacial.
The climate of the Holocene has not been as dramatically variable as that of the late Pleistocene, but oscillations have been substantial enough to affect biota and the human cultures that depended upon them. Vegetation changes through the Holocene, as represented by shifting pollen frequencies, were first recognized by Deevey (1939) in New England. He labeled the successive zones as T or L (herb), A (spruce), B (pine), and C (oak). Deevey correlated these zones with the Northern European pollen/climate sequence (Blytt-Sernander terminology). Using radiocarbon dates, Wendland and Bryson (1974) discerned a succession of Holocene climate episodes (Pre-Boreal [10,800-9200 rcbp, or 12,800-10,500 cal BP], Boreal [9200-8000 rcbp, 10,500-9000 cal BP] Atlantic [8000-4200 rcbp, 9000-4800 cal BP], Sub-Boreal [4200-2500 rcbp, 4800-2700 cal BP], Sub-Atlantic [2500-1800 rcbp, 2700-1800 cal BP], Scandic [1800-1100 cal BP], Neo-Atlantic [1100-700 cal BP] and Pacific [700 cal BP-present]).
More recently, analyses of North Atlantic sediments have demonstrated a roughly 1500-year recurrence of ice-rafted debris (IRD) events, which are interpreted as markers of sudden cold episodes accompanied by major reorganizations of atmospheric circulation (Bond et al. 1997, 2001). A growing corpus of regional proxy records has been amassed (pollens, carbonates, midges, plant macrofossils), which shows both pan-continental episodes (e.g., Hypsithermal warming) but also local variability and out-of-phase changes of climate. Some of the salient Holocene climate episodes for northeastern North America, after the 11,650 cal BP warming, include the following.
The sharpest of the Holocene cold oscillations occurred early on; these are the Pre-Boreal Oscillation at about 11,300 cal BP and the 8200 cal BP cold event. The latter has been attributed to the final massive draining of glacial Lake Agassiz into the North Atlantic, an event which would have disrupted thermohaline circulation. The flood event may also be related to accelerated wasting of the remnant Laurentide ice sheet between 8400 and 7900 cal BP (Shuman et al. 2002). The effects of the 8200 cal BP event may have lasted for about 400 years.
There also appears to have been a 200-year cooling event at 10,300 cal BP (Björck et al. 2001). This event may have been caused by weaker solar radiation.
Variations in solar output also seem to have been responsible for the “Bond events,” cooling episodes in the North Atlantic that occurred about every 1,500 years throughout the Holocene, and probably also during the Pleistocene (Bond et al. 2001). The eight Holocene events are dated to about 11,100, 10,300, 9400, 8100, 5900, 4200, 2800, and 1400 cal BP. The modeled causative mechanism involves reduced solar irradiance, triggering changes in stratospheric ozone that caused cooling of the atmosphere in high northern latitudes, a slight southward shift of the northern subtropical jet stream, and decreased Northern Hadley circulation. These atmospheric changes would then have led to increased North Atlantic drift ice, cooling of the ocean surface and atmosphere above Greenland, and reduced precipitation in low latitudes (Bond et al. 2001).
Viau et al (2002) and Gajewski et al. (2007) examined radiocarbon dates obtained for more than 700 pollen diagrams from across North America. These dates tend to cluster at significant discontinuities in the climate record. The major transitions identified by Viau et al. within the past 14,000 calendar years occur at 13,800, 12,900, 10,190, 8100, 6700, 4030, 2850, 1650, and 600 cal BP. Their analysis did not attach a direction (cooling or warming) to the vegetation changes observed at each transition, but it is clear that those changes were pan-continental. Four of the vegetation events correspond rather closely to Bond events (10,190=10,300, 8100=8100, 4030=4200, 2850=2800). More recently, Gajewski, Viau and Sawada (2007) have synthesized dates for North American and European pollen transitions, Bond events in the North Atlantic, and cold spikes in the Greenland ice cores, to identify trans-hemispheric “climate transitions” at 13,900, 12,800, 11,100, 10,300, 9000, 8100, 6800, 5900, 4200, 2800, 1600, 600, and 350 cal BP.
The Atlantic 2 event (6700 cal BP) is very broadly defined, with a large standard deviation in the radiocarbon dates. In the Midwest this was a period of transition to a warm and dry climate.
The Sub-Boreal vegetation event (4030 cal BP) coincides with the beginning of neo-glaciation in the northern hemisphere. It is a cooling that follows decreasing insolation. The 2850 cal BP event is also a cooling (Sub-Atlantic), but the 1600 cal BP event (Scandic) is the beginning of the warming that culminated with the Medieval Warm Period at 1000 cal BP.
Li et al. (2006) presented evidence of several episodes of lowered water levels in White Lake, located about 10 miles east of the Delaware Water Gap in New Jersey. These episodes are dated to about 6100, 4400, 3000, and 1300 cal BP. They are interpreted as dry periods that were synchronous with cold Bond events in the North Atlantic; however, Bond events are not evident in the record from nearby Lake Grinnell (Zhao et al. 2010). There, the major Holocene climate change was a shift to a cool, dry climate at 5800 cal BP, attributed to reduced solar radiation.
Pollen sequences from the beds of several lakes in the Catskills and Hudson Valley offer records of local vegetation changes and inferred regional climate shifts during the Holocene. These records come from: Lake Mohonk and Lake Minnewaska in the Shawangunk Mountains (Menking et al. 2012); Balsam Lake in the western Catskill Mountains (Ibe 1982, 1985); Sutherland Pond (41°23'29''N, 74°02'16''W) in Orange County and Spruce Pond near Tuxedo Park in Rockland County (41°14'22''N, 74°12'15"W) (Maenza-Gmelch 1997).
At the onset of the Holocene, the climate in the Shawangunk Mountains became warm and dry from 11,500 to 8700 cal BP. The forest was dominated by white pine, while oak increased. At Balsam Lake, fir and spruce had been dominant around 14,000 cal BP, but they were largely replaced by pine, which peaked ca. 10,200 cal BP. By 7800 cal BP the pines had been replaced by hemlock, birch, beech, and maple.
To the south, in Orange and Rockland counties (the Hudson Highlands), the oak-dominated forest was invaded by white pine (Pinus strobus) at the end of the Younger Dryas (ca. 11,700 cal BP). Hemlock arrived here at 11,000 cal BP, followed by beech at 9000 cal BP.
Farther east, the period from 10,100 to 7700 cal BP appears to have been very dry in southern New England. Ambrosia (ragweed) pollen indicates the existence of open savanna-like areas on ridgetops and knolls. These areas were probably created mainly by fire, although deer-browsing and anthropogenic ignition may have played a role in maintaining these open patches (Faison et al. 2006).
The early Holocene climate of New England was cool and very dry from 11,600 to 8200 cal BP; the region’s forests were dominated by white pine, accompanied by maple and oak. The regional climate was warm and wet during the middle Holocene, from 8200 to 5400 cal BP, when the temperature rose by as much as 3 to 7 degrees C. Oak, beech and hemlock flourished in this warm, wet climate. It remained warm but became markedly drier from 5400 to 3000 cal BP. Oak trees were still prevalent, but hemlocks collapsed abruptly at ca. 5500 cal BP, probably because of the combined effects of droughts and pathogens. After 3000 cal BP the climate became somewhat cooler and very wet, conditions that encouraged the spread of chestnut and resurgence of hemlock (Davis et al. 1980; Shuman et al. 2004).
Superimposed on these general trends are abrupt, brief episodes of climate change, e.g., cold and dry conditions at 10,600, 10,200, 9500, 9200, 8800, and 8400 cal BP. These cold episodes are attributed to the effects of draining of freshwater from proglacial lakes into the North Atlantic, which disrupted the overturning circulation of warm, salty southern water (Hou et al. 2011).
Shuman et al. (2009) infer episodes of regional drought from the occurrence of sand layers attributed to lowered water levels in New Long Pond in Plymouth, MA. These drought episodes are dated to ca. 8425 to 8300, 5390 to 5260, 4680 to 4445, 3920 to 3695, 2980 to 2760, 2355 to 2040, and 1595 to 1460 cal BP.
Newby et al. (2011) report a similar drought record from Davis Pond in southwestern Massachusetts. Low water levels are inferred for these periods: 13,400 to 11,000, 10,900 to 10,400, 10,200 to 9500, 9200 to 9000, 8200, 7700, 6600 to 6400, 5600 to 4900, ca. 4100, 3500 to 3000, 3000 to 2800, 2700 to 2300, and 1600 cal BP.
In the Hudson Highlands sequence, high percentages of oak pollen correlate with a continuous charcoal influx throughout the record, which suggests that fire was a factor in the expansion and maintenance of oaks in the forest. A temporary reduction in fire frequency around 11,000 cal BP seems to have encouraged expansion of hemlock (Maenza-Gmelch 1997).
In the Shawangunk Mountains, a wet interval from 8700 to 8000 cal yr BP is indicated by increased hemlock, beech, and birch pollen, while oak declines. Maximum wetness there is dated to 8100 cal yr BP, possibly connected with the 8200 cal BP cold event.
The climate in this area was warm and dry from 7900 to 7300 cal yr BP. The landscape became unstable as soil erosion increased. There is an uptick in charcoal particles in the cores, indicating that drought led to frequent outbreaks of fire. In these conditions, oak thrived while hemlock declined and beech was slightly less abundant than before.
A Middle Holocene wet interval in the Shawangunk Mountains, from 7100 to 5700 cal yr BP, saw a decline in oak, increased hemlock, and limited prevalence of pine. Several pollen sequences in New England reveal a similar climate (Shuman et al. 2004; Oswald et al. 2007). However, at Davis Pond low water levels indicate a drought from 6600 to 6400 cal BP (Newby et al. 2011). There are also indications of aridity in northern New Jersey and central New York; the water level in White Lake dropped at ca. 6100 cal BP (Li et al. 2006) and Cayuga Lake fell to a lowstand at 6830 cal BP (Mullins 1998). Hickory pollen increases slightly at 7000 cal yr BP in the Shawangunk Mountains cores, which suggests a warming trend. At the same time, 7100 cal BP, hickory first appears in the Hudson highlands pollen sequences.
Multiple changes in climate and environment coincided at ca. 5800 to 5400 cal BP. These include Bond event 4 and droughts in the Northeast and Mid-Atlantic. At the hemispheric scale, this is also the time of transition from the Middle to Late Holocene (Zhao et al. 2010). Hemlock (Tsuga canadensis) populations collapsed abruptly throughout the Middle Atlantic and Northeast at ca. 5500 cal BP (4750±50 rcbp) (Bennett and Fuller 2002). The proximate cause was probably a pathogen or insect infestation (Bhiry and Filion 1996); but the trees may already have been weakened by drought. The collapse involved two successive events, around 5800 and 5200 cal BP; these correspond to two coeval lake-level drops in the Northeast, which indicate drought conditions (Haas and McAndrews 1999). The first drought event seems coeval with the 5900 to 5800 cal BP Bond event. Low water levels at Davis Pond indicate an extended drought from 5600 to 4900 cal BP (Newby et al. 2011). Winters seem to have become colder at the same time (Calcote 2003). Peteet et al. (2011) reported evidence of droughts in the lower and mid-Hudson Valley at 5745 and 5480 cal BP. These droughts and temperature changes in the Northeast could have weakened the trees so that they became susceptible to pathogen outbreaks (Foster et al. 2006; Haas and McAndrews 1999).
In the Shawangunk Mountains, the onset of a Middle Holocene drought at 5700 cal BP appears to have caused the collapse of hemlock. During this drought, pitch pine (Pinus rigida), a fire-adapted tree, colonized the ridge. This is the only period when it was present in this area. Oak pollen increased. The local collapse of hemlock (Tsuga) occurred at ca. 5400 cal BP. Hemlock also collapsed at Ballston Lake at the same time (5300 cal BP) (Toney et al. 2003). The hemlock decline is a little later at Balsam Lake (ca. 5100 cal BP) and seems anomalously late in the Hudson Highlands, ca. 4700-3800 cal yr BP (Maenza-Gmelch 1997).
The very arid conditions in the Shawangunk Mountains continued until 4100 cal BP. The drought and the hemlock die-off may have facilitated an expansion of chestnut (Castanea), which became very abundant in this vicinity. Chestnut is drought-tolerant but shade-intolerant, and thrives in disturbed areas. When the hemlock trees died off, the forest canopy opened and allowed more sunlight to reach the floor; the reduced shade favored the growth of chestnut trees. Chestnut arrived a little later in the Hudson Highlands, ca. 3900 cal BP.
There is evidence of roughly contemporaneous aridity both in central New York and northern New Jersey. Cayuga Lake dropped to a lowstand at 4770 cal BP (Mullins 1998) and White Lake dropped to a low level ca. 4400 cal BP (Li et al. 2006).
On the Shawangunk ridge, the climate seems to have been wetter between 4100 and 2300 cal yr BP. Hemlock recovered and beech flourished. At Balsam Lake, a partial hemlock recovery is also evident in this period. Chestnut had appeared here by 2600 cal BP (Ibe 1982, 1985).
At Davis Pond, low water levels indicate droughts ca. 4100, 3500 to 3000, 3000 to 2800, 2700 to 2300, and 1600 cal BP. A drop of the water level of White Lake in northern New Jersey indicates aridity ca. 3000 cal BP (Li et al. 2006). Cayuga Lake fell at 3200 cal BP and reached its lowest level around 1950 cal BP, after which it rose until around 950 cal BP (Mullins 1998). Mullins et al. (2011) infer an abrupt cold, dry episode starting around 3000 cal BP and persisting to 2400 cal BP; they hypothesize it may have been caused by reduced solar activity.
The last drought occurred on the Shawangunk ridge between 2300 and 1000 cal BP. This arid episode was less intense than the middle Holocene drought. In fact, there are indications of a more humid climate starting ca. 1400 cal BP (AD 600). The inferred aridity here appears out-of-phase with records from New England, where many lakes rose to their maximal levels after 3000 cal yr BP. In central New York, a lowstand of Cayuga Lake implies a drought around 1950 cal BP (Mullins 1998). At White Lake in northern New Jersey, a lowered water level indicates an arid episode about 1300 cal BP (AD 700) (Li et al. 2006).
Peteet et al. (2011) reported charcoal peaks and coincident pollen frequency changes in cores at Tivoli Bay and Piermont in the Hudson Valley. They interpret these as records of severe aridity from about AD 850-1350. Tree rings indicate another major pre-Contact drought in the Catskills that lasted from AD 1555 to 1578 (Pederson et al. 2013), as well as other episodes in the 16th and 17th centuries.
A recent synthesis of paleoenvironmental proxies across the Northeast finds a long-term cooling trend from 3000 cal BP to AD 1700. A widespread, prolonged drought occurred around AD 550-750 (1400-1200 cal BP). It was warmer and drier than today during the Medieval Climate Anomaly (ca. AD 950-1250) (Marlon et al. 2017).
According to Braun (1950) at the time of European arrival this region hosted a northern prong of the Oak-Chestnut Forest Region. However, there is some ambiguity about the native vegetation due to the pervasive impacts of Euro-american forest clearance and agriculture since the 1600s. The structure of the remnant forests also was affected by the chestnut blight, caused by a fungus from Japan that was first recognized at the Bronx Zoo in 1904. Spreading about 50 miles a year, this fungus had wiped out all the mature chestnut trees of the eastern US by 1940.
As described by Braun, the Oak-Chestnut climax forest had a canopy consisting of American chestnut, chestnut oak, red oak, white oak, black oak, scarlet oak, white basswood, shagbark hickory, pignut hickory, tulip tree, beech, and yellow buckeye. Below these, the subcanopy contained red maple, black birch, black gum, dogwood, shadbush, hop hornbeam, sassafras, and shadebush. The shrubs growing below the trees included mapleleaf viburnum, mountain laurel, blueberry, azalea, rhododendron, Menziesia, spicebush, scrub oak, and witch-hazel.
A minor component of the climax forest was butternut (or white walnut, Juglans cinerea). Nevertheless, these trees were apparently very important to the indigenous people. Funk (1993:47) notes that, at sites on the Upper Susquehanna, charred butternuts and walnuts are very common in contexts dating from the Late Archaic through Late Woodland. Butternut shell fragments dominated the samples from Vosburg phase (ca. 5300-5000 cal BP) features at the Kingston Armory site near the Hudson; a minor amount of hickory also was present (Asch Sidell 2008). Black walnut (Juglans nigra) and hickory (Carya) nutshells were recovered from the Vergennes phase occupation (ca. 6000 rcbp, 6800 cal BP) at this site (Gould et al. 2008). It is noteworthy that white walnut does not tolerate shade and therefore cannot grow under a canopy of taller trees. This might imply that the prehistoric people were intentionally creating more open habitats where this economically important tree could thrive. Skinner (1919) noted the presence of burned hickory and walnut shells in the pre-Contact Throgs Neck and Clasons Point shellheaps in the Bronx. Curiously, Skinner also reported recovery of calamus root, also known as sweet-flag, from both sites. This plant was used by northern Algonquians as a medicine, and possibly also as a hallucinogen.
Native Animals of Land and Water
Eastern North America had been depleted of its largest native mammals—e.g., mastodont, mammoth, stag-moose, giant beaver, giant ground sloths—by the Terminal Pleistocene megafaunal extinction at 13,000-12,700 cal BP (11,000-10,700 cal BC) (more on this, below). Caribou, which had been present in New England retreated northward, while elk, moose, and gray wolf migrated southward from Beringia.
In the pre-Contact Throgs Neck and Clasons Point shell heaps, thousands of bones were preserved (Skinner 1919). The most common animal represented among these remains was the white-tailed deer. Bones of domestic dogs, raccoons, otters, and wild turkeys were present at both sites. Elk, black bear, and beaver were identified at Throgs Neck. Woodchuck and skunk bones were recognized at Clasons Point. At both sites, many fragments of tortoise and turtle shell were found, representing box, painted, spotted, and musk tortoises, and snapping and diamond-back turtles. No marine turtle remains were found at either site. Although bones of neither wolves nor cougars were found at the Bronx sites, we know from colonial documents that they frequented southern New England in the seventeenth century. No doubt, fox, bobcat, rabbit, opossum, and muskrat were also native to the region, as well as passenger pigeon (now extinct since 1914), grouse, ducks and geese.
The Throgs Neck shellheap consisted mainly of oysters, with just small numbers of hard clams and scallops. Land snails, black mussels, grey mussels, and two species of conch (whelk) also were present. Skinner (1919) reported bones of sturgeon, smooth dogfish (a small shark), bluefish and drumfish from pits at Clasons Point. Remains of blue crab and lobster also were recovered. In contrast, surprisingly few fish bones have been recovered from most of the excavated prehistoric shell middens on the Connecticut and Rhode Island coast. Today, Atlantic and short-nosed sturgeon are now very rare in the Sound, and so are drumfish. Bluefish and smooth dogfish are still abundant. Among the other fish living in Long Island Sound today are striped bass, summer flounder (fluke), winter flounder, scup (or porgy), hickory shad, black sea bass, weakfish, and tautog (blackfish). Oysters, clams, and scallops still live in the Sound, as do crab and lobster (although lobster numbers have declined dramatically in the past 20 years).